AlienResistance.org
averages
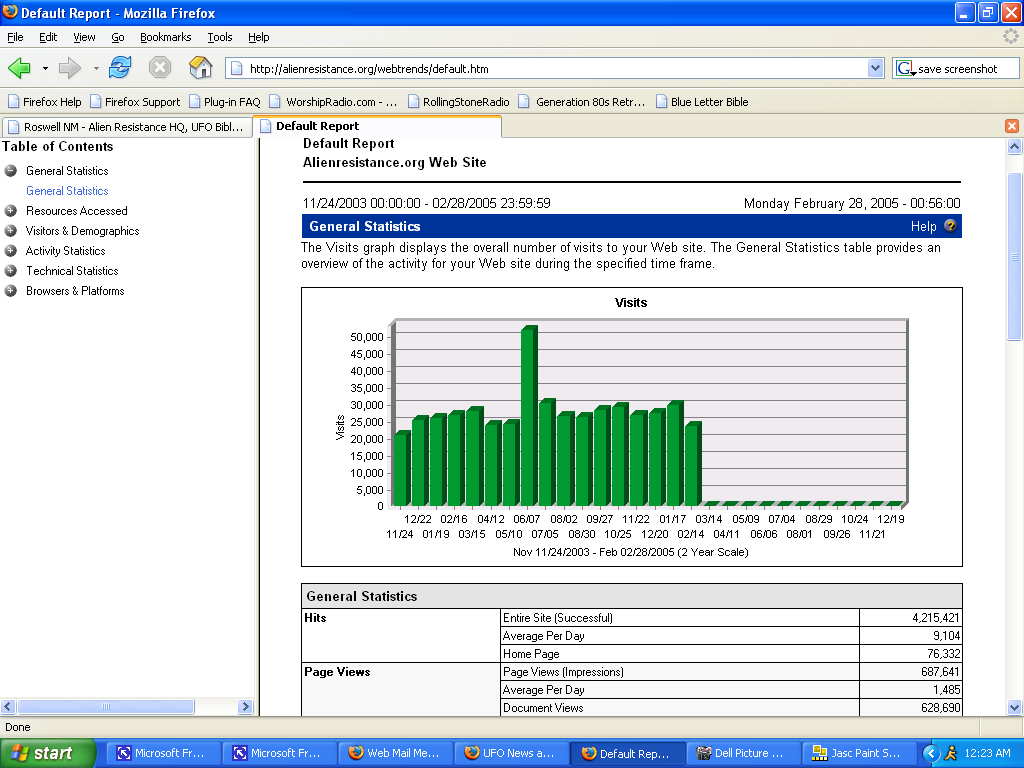
1,485 Page Views Every Day
This
graph means that over the past 15 months it records, this site has averaged
1485 page views per day! See
number at bottom right of image.
(The number for "Hits" is irrelevant here, as a page with 20 images registers as 20
"hits.")
In 2000, I considered 100 per day a lot!
Top Level Domains:
just interesting...
This one tells us just a little info about site visitors (again, only if
Webtrends can capture the info - actual numbers are 4-5 times higher). While most people
were probably at home surfing from their ".com" or ".net" ISP, it is
interesting to note that over 2,500 visitors to this site were sitting at a desk connected to a
".gov"(ernment)
or ".mil"(itary) computer -
Yikes, we're being spied on!
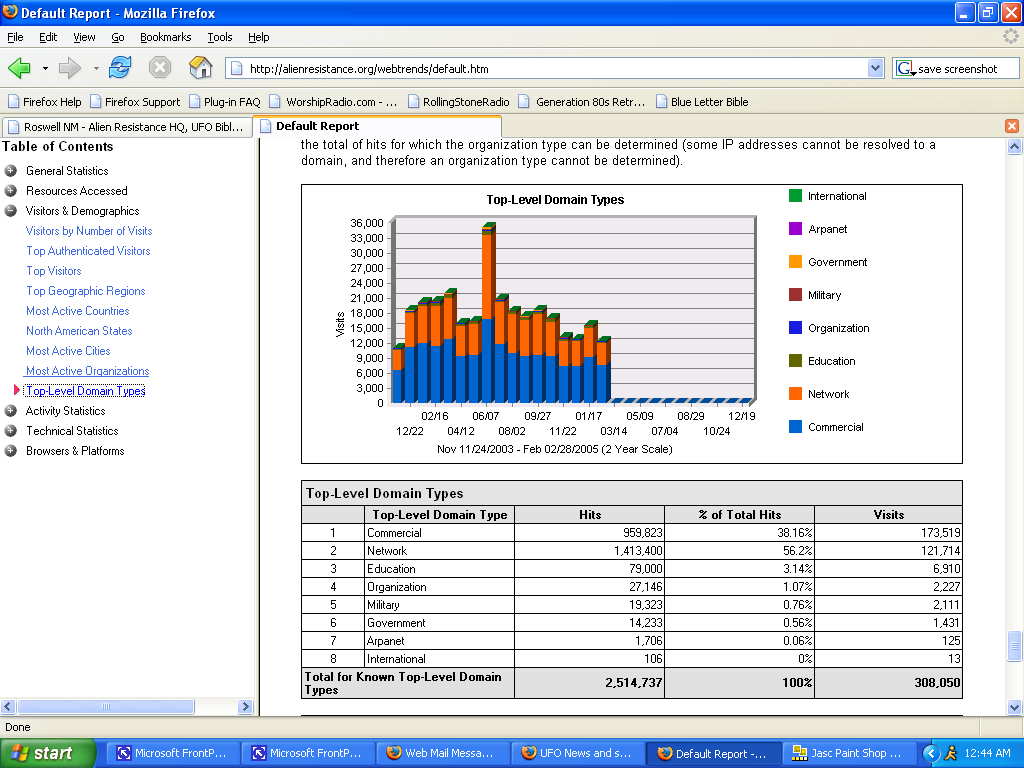
Almost 7,000 visitors shown (30-35,000 actual) were from ".edu" - which also means your kids are studying Alien Resistance at school. Be very afraid!
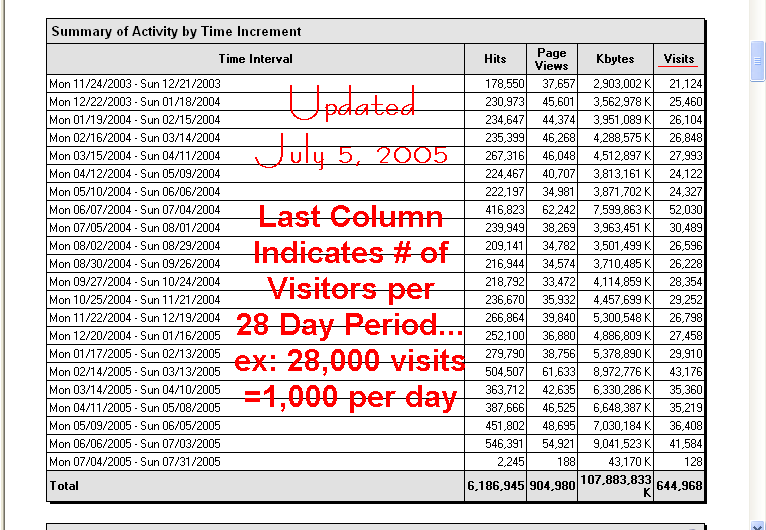
Updated July 5, 2005
Reading the last column, you'll see that this site gets over 1000 unique visitors per day,
Below shows that over the life of the site, we have averaged about 1000 visits per day...
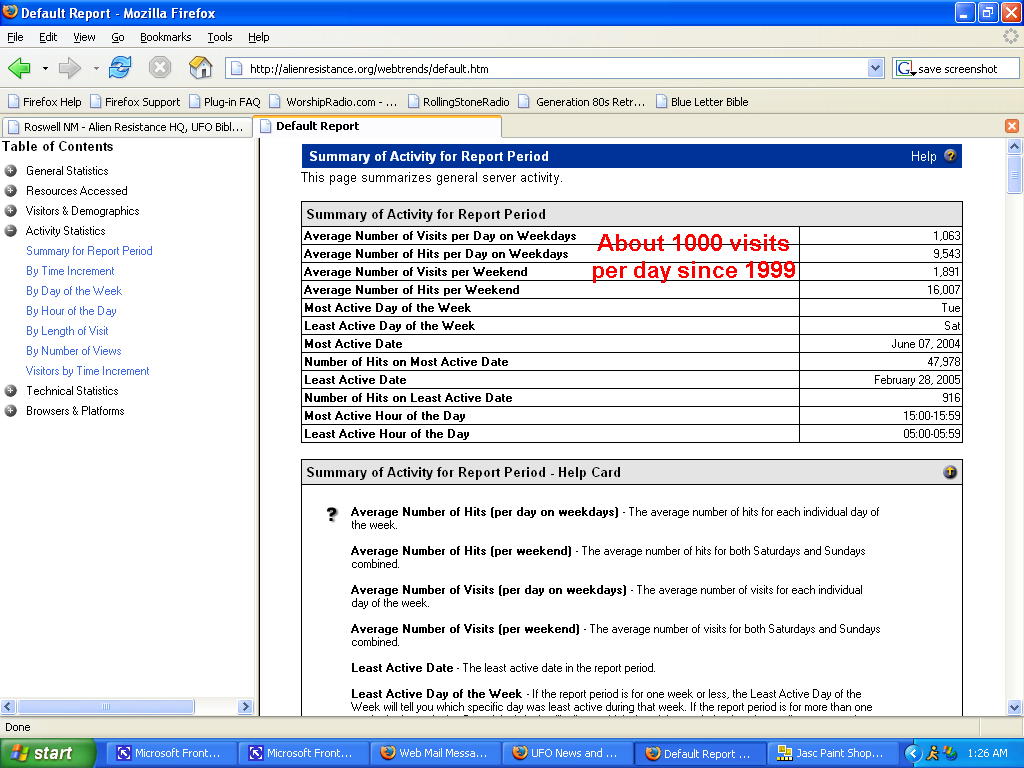
Just 365,000 x 3 means that we exceed 1,000,000 visitors every 3 years. If the trend at top middle continues however, it will take less than 2 years to reach 1,000,000 people with these views. How many missionaries do you know that can say that?
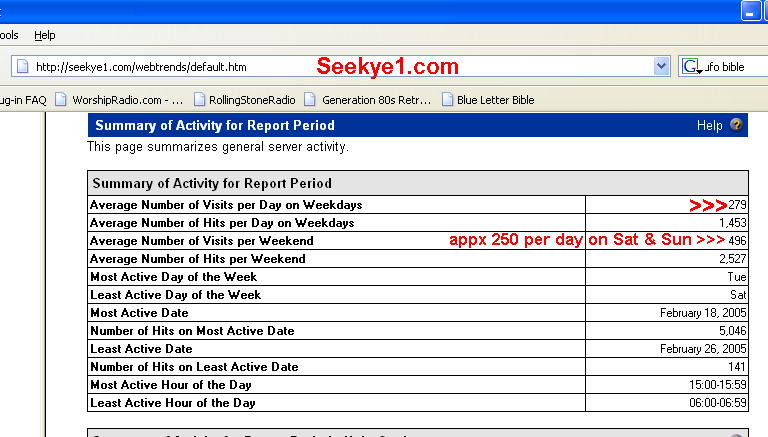
Honorable mention - Come Sail Away
My first website and online book / testimony gets over 250 visitors per day
on average (or 7,500 per month). Is this little site effective all by
itself?
Read it's
guestbook
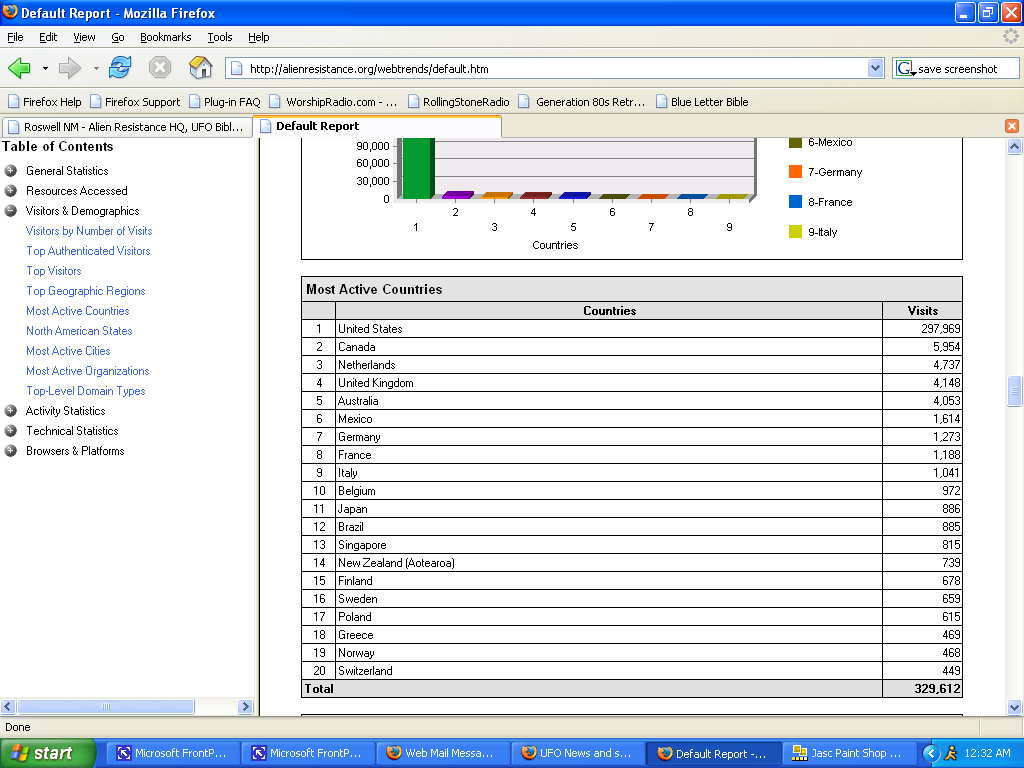
Visiting
Countries
This is my "missionary pitch"
statistic for this site.
The above lists which countries site visitors come from. Unfortunately, the "Webtrends" software is not always able to determine this, or the numbers would obviously be much higher. The above reflects 329,000 visitors, which is less than the site received in the past year. (So either this is just for the past year, or the software can only determine locations for about 20% of visitors. Either way, actual numbers would be 4-5 times higher).
What does this mean? Although I've never been there personally, over 4000 documented (and maybe 20,000 actual) people from the UK have visited this site, as have over 4000 from Australia. The bottom one is Switzerland, with 449 (so perhaps 2000) visitors recorded. Note that Webtrends only reports the Top 20 visiting countries, so the number of countries with over 100 visitors is probably very, very high (i.e., most of them!) I remember when the country on bottom had only 2 visits!
But what this chart reveals for certain, is that even if I'm just lying around in my underwear eating pizza and watching X-Files, the word is going forth to thousands of people in France, Norway, The Netherlands, Japan, etc, etc, etc...
How many missionaries do you know that can say that? How many do you support that can say that? 10% of our site visitors are non-U.S. (according to the above chart).. and appx 30,000 visitors per month documented - means this site reaches over 3,000 people outside the U.S. per month, in at least 20 countries. The 20,000+ per month in the states are important too btw;)
I hope more will considering supporting this work, as obviously you can now see that we are reaching many, many people. Click here for more about our offline activities.
![]()
this report generated by webtrends